Predict
Make enrollment trajectory, target LPI, country activation, confidence, and odds of success understandable at a glance.
Lokavant case study · Clinical-trial intelligence
I reworked dense CRA and CRO workflows during a platform consolidation, then connected product strategy, UX, design systems, front-end implementation, demos, and marketing into one reusable system.
A reusable product and storytelling system replaced one-off production.
Sharper product positioning improved campaign response.
Studies represented across integrated data sources.
Product capability communicated in shipped materials.
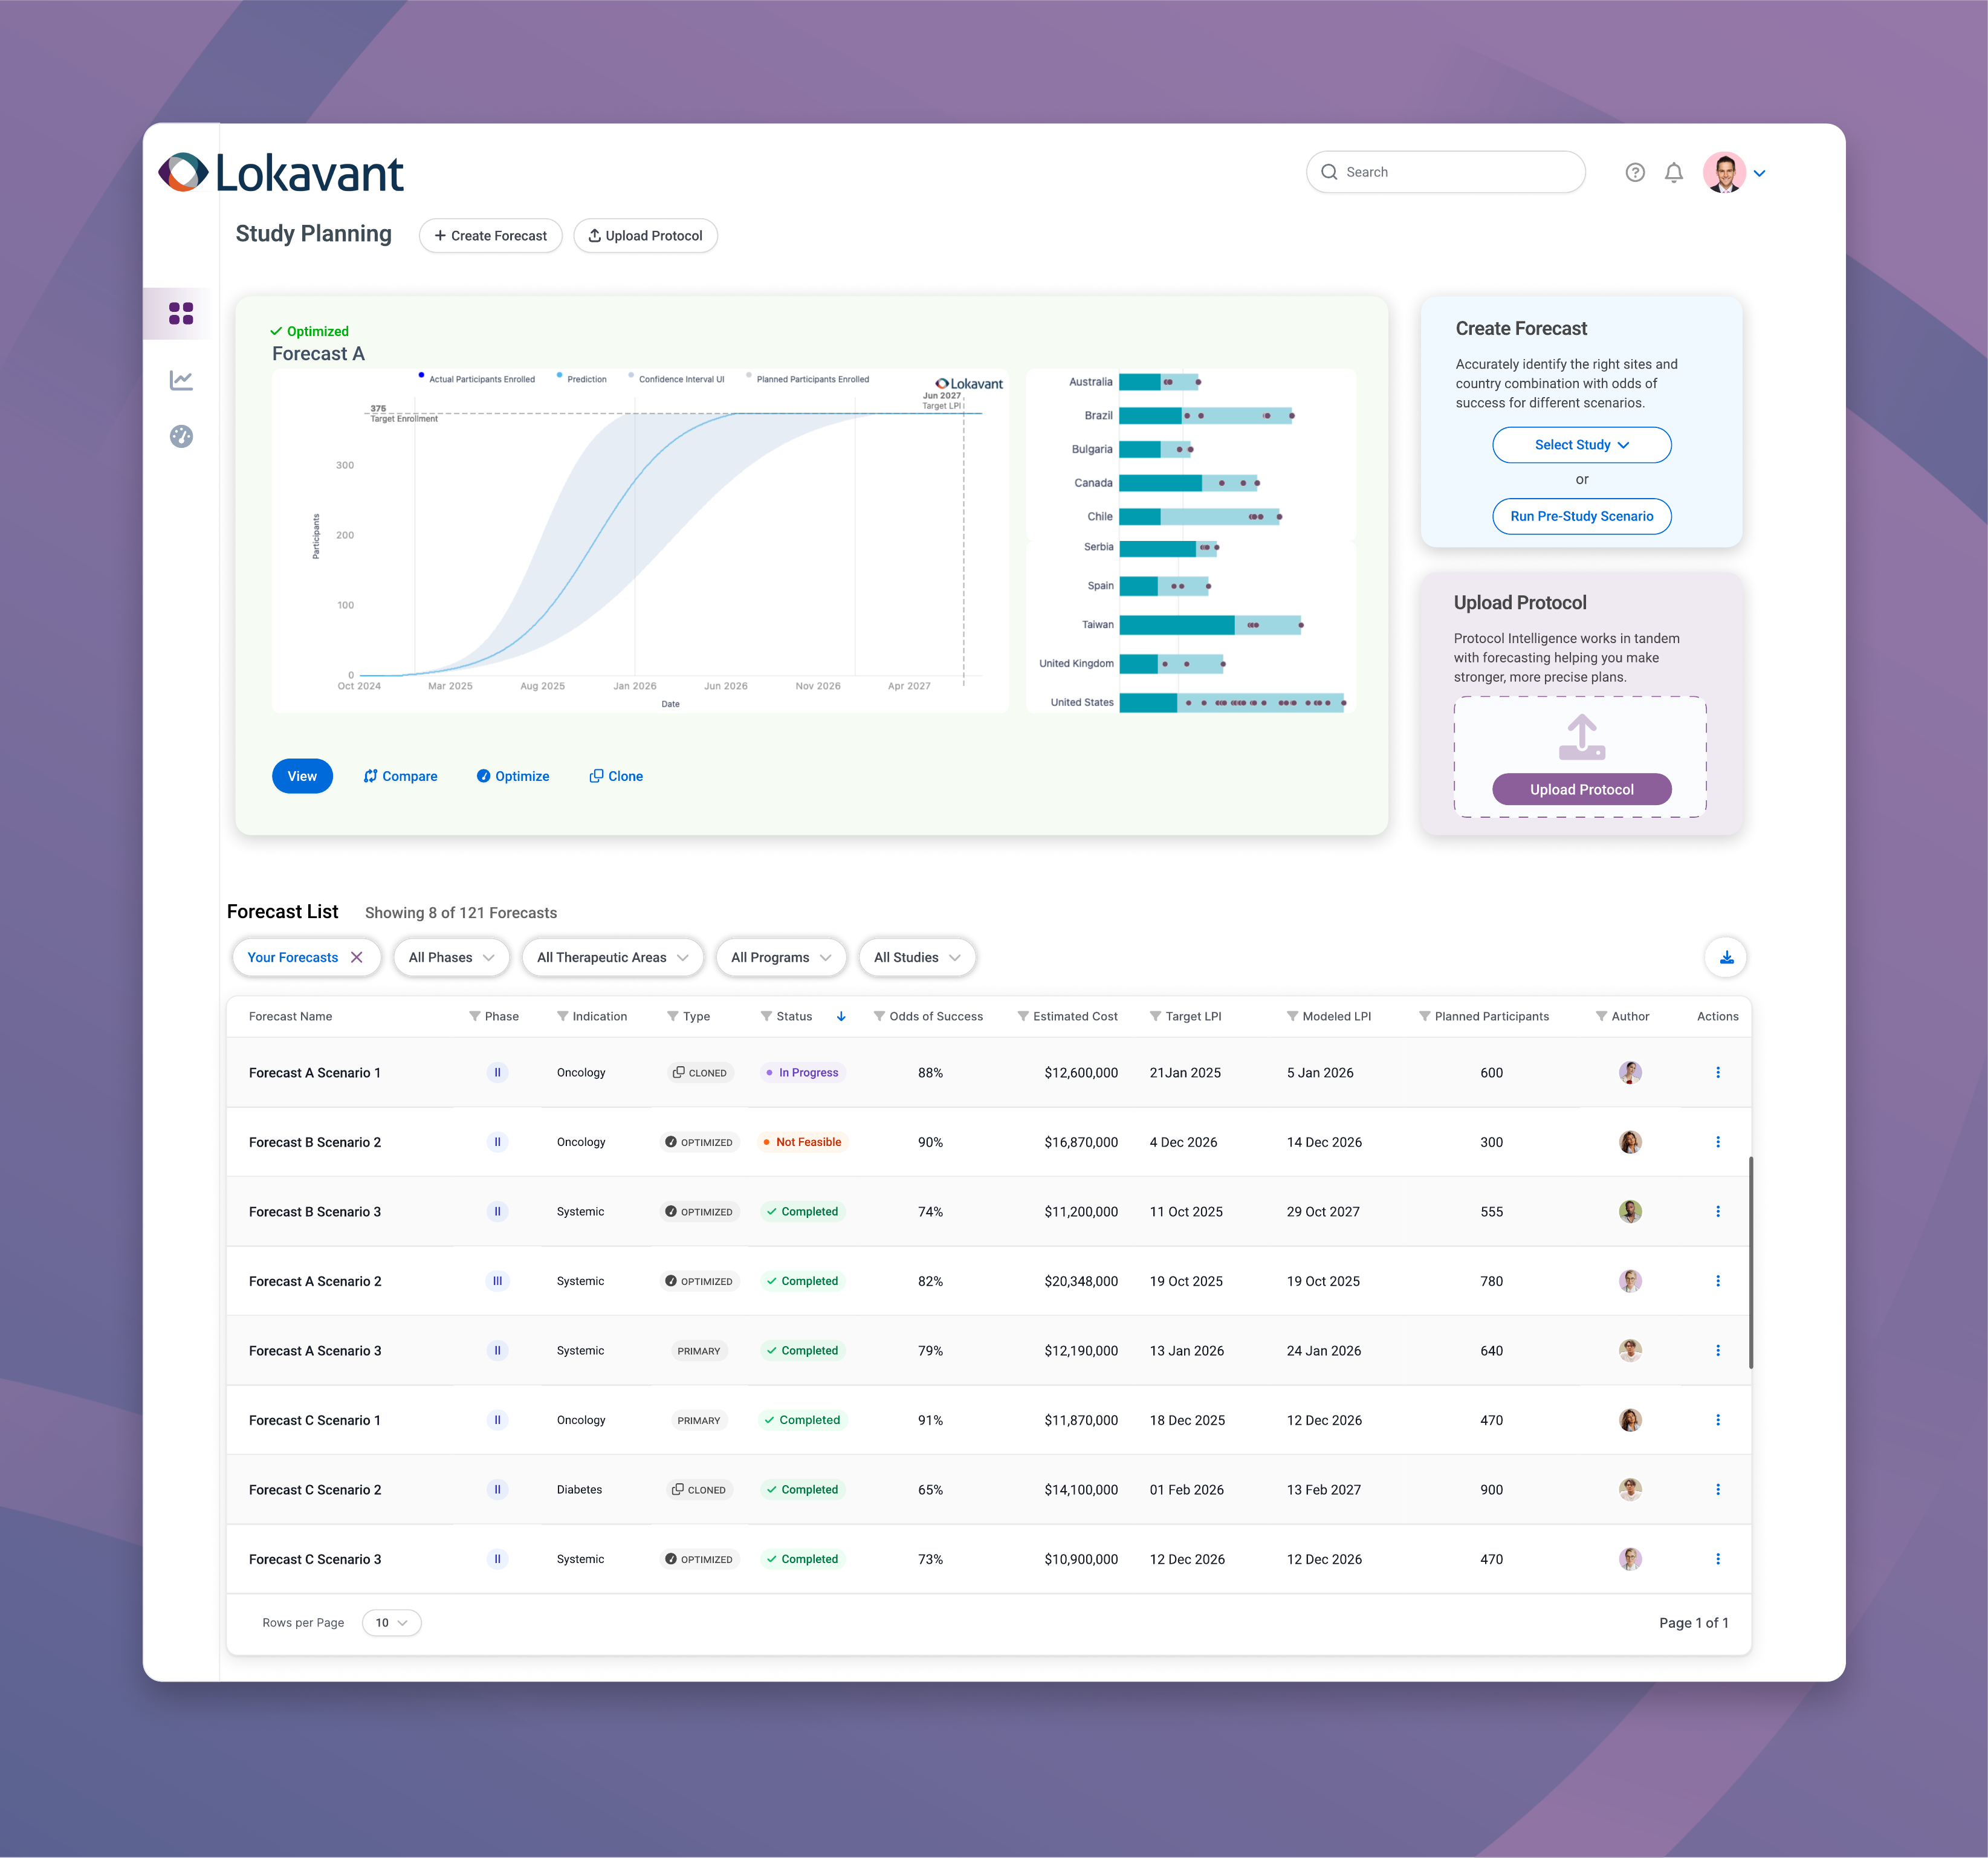
Problem / Powerful models, fragmented product
Clinical teams moved between dense tables, charts, wizards, and disconnected tools to plan enrollment, compare scenarios, and adjust active studies. Important assumptions and system states were difficult to follow.
A forecast is not a single prediction. Teams must define the study, understand protocol constraints, choose countries and sites, model enrollment, estimate cost, compare historical evidence, and revisit the plan as real data arrives. The interface exposed pieces of that machinery without yet giving users one coherent decision path.
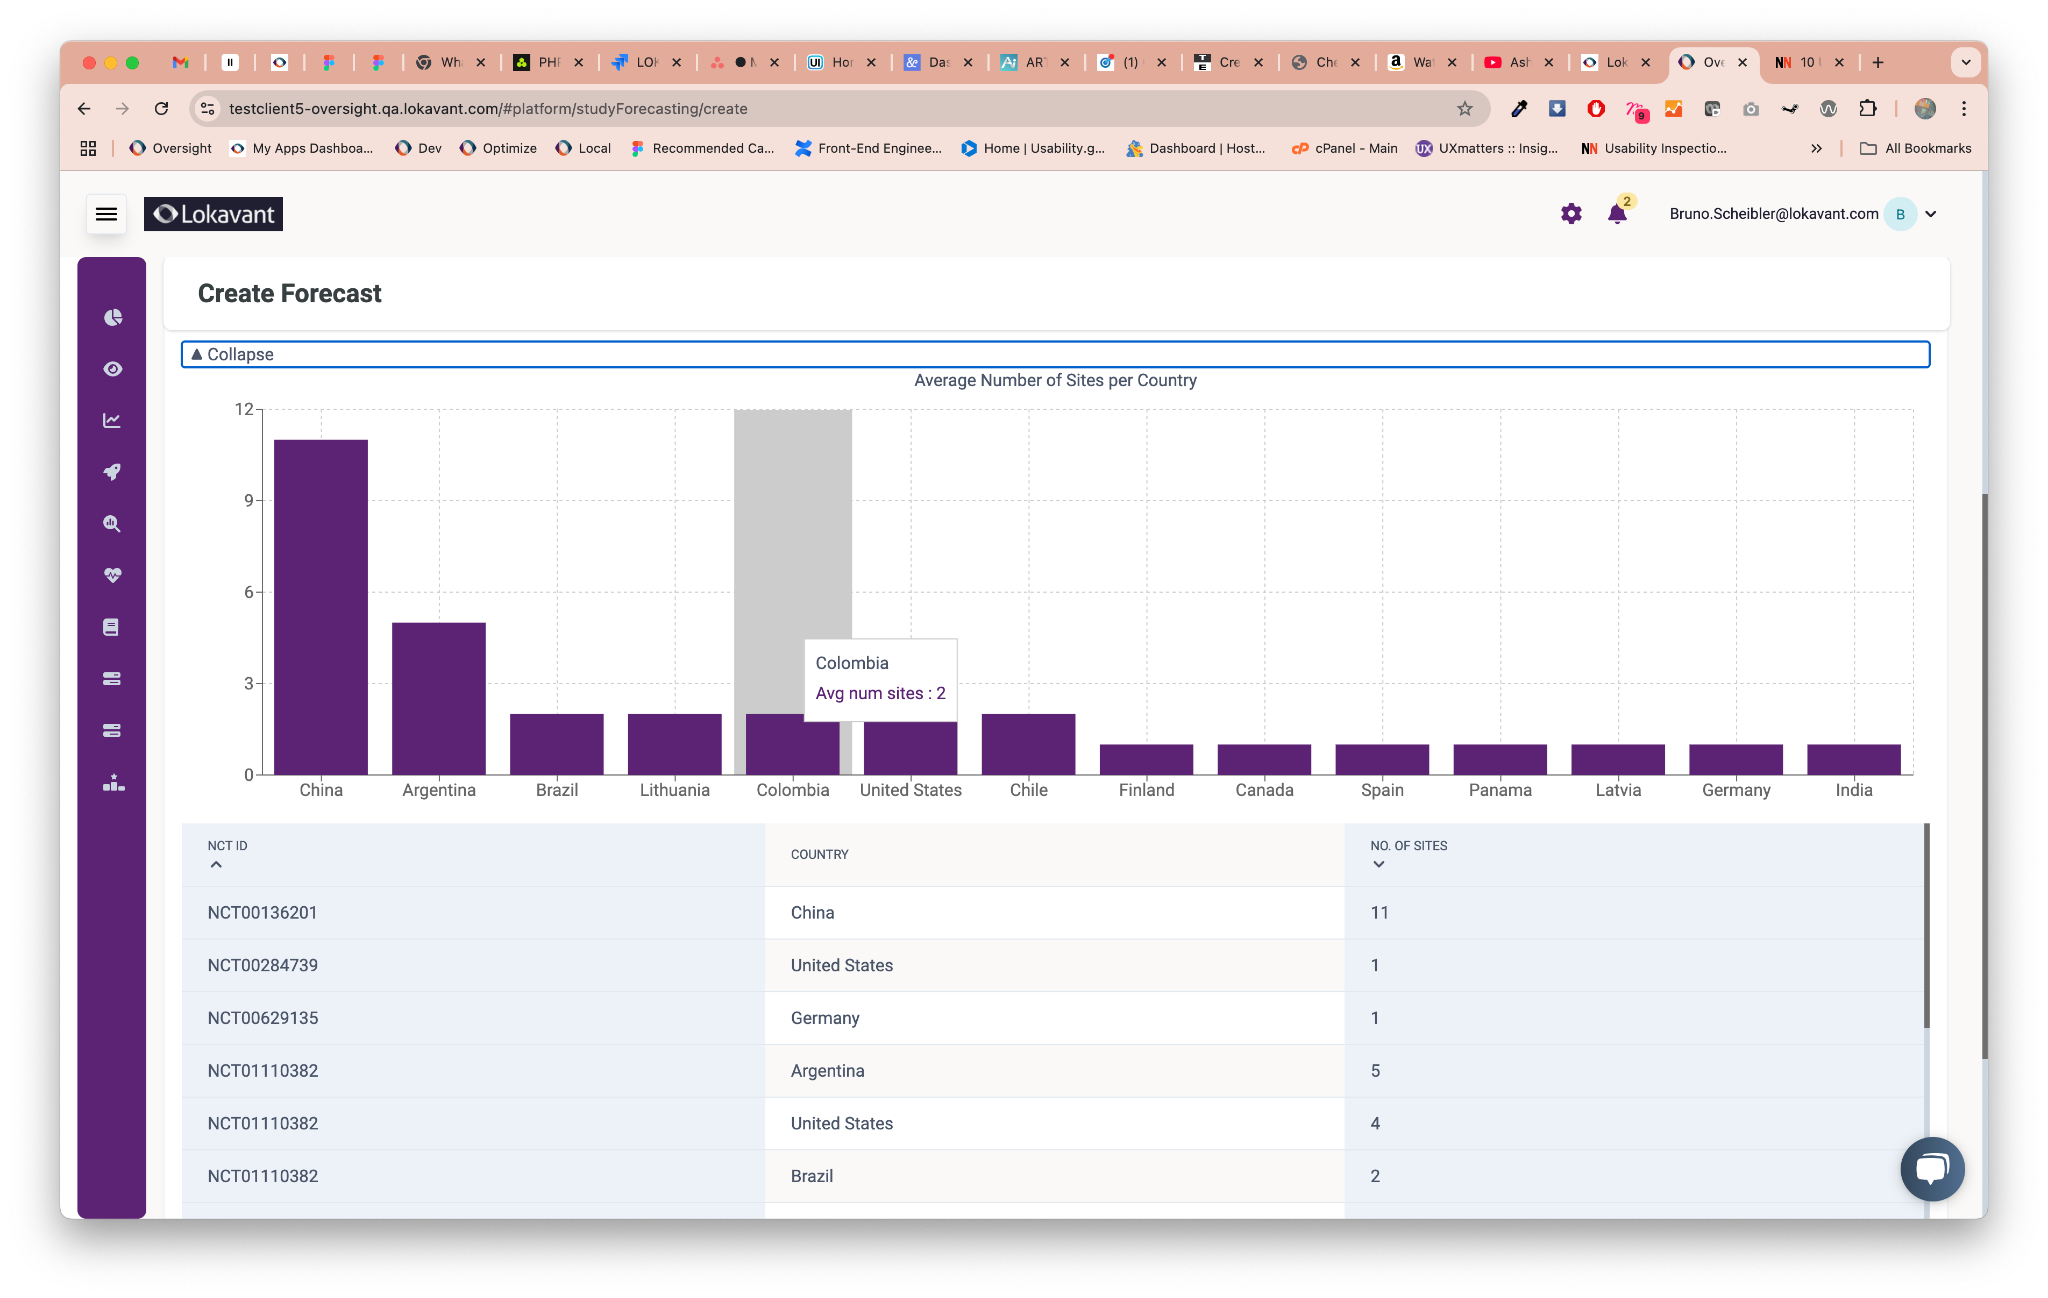
CRAs and CRO teams needed to move between planning and in-flight study management without losing the assumptions, evidence, or reasoning behind a forecast.
AI outputs could look authoritative while hiding uncertainty. Teams needed to see confidence ranges, comparisons, constraints, and consequences before acting.
Why it mattered / Decisions under pressure
Country selection, site mix, cost, target enrollment, and last-patient-in timing affect one another. A small change can alter feasibility, budget, and delivery risk across an entire study.
Change one input and the downstream decision can move. The interface therefore had to expose dependencies and consequences—not simply report a model output.
Approach / Reframe the product
I reframed Spectrum as a trial decision workspace. The product needed to help teams predict what might happen, optimize a plan against real constraints, and control the study as conditions changed.
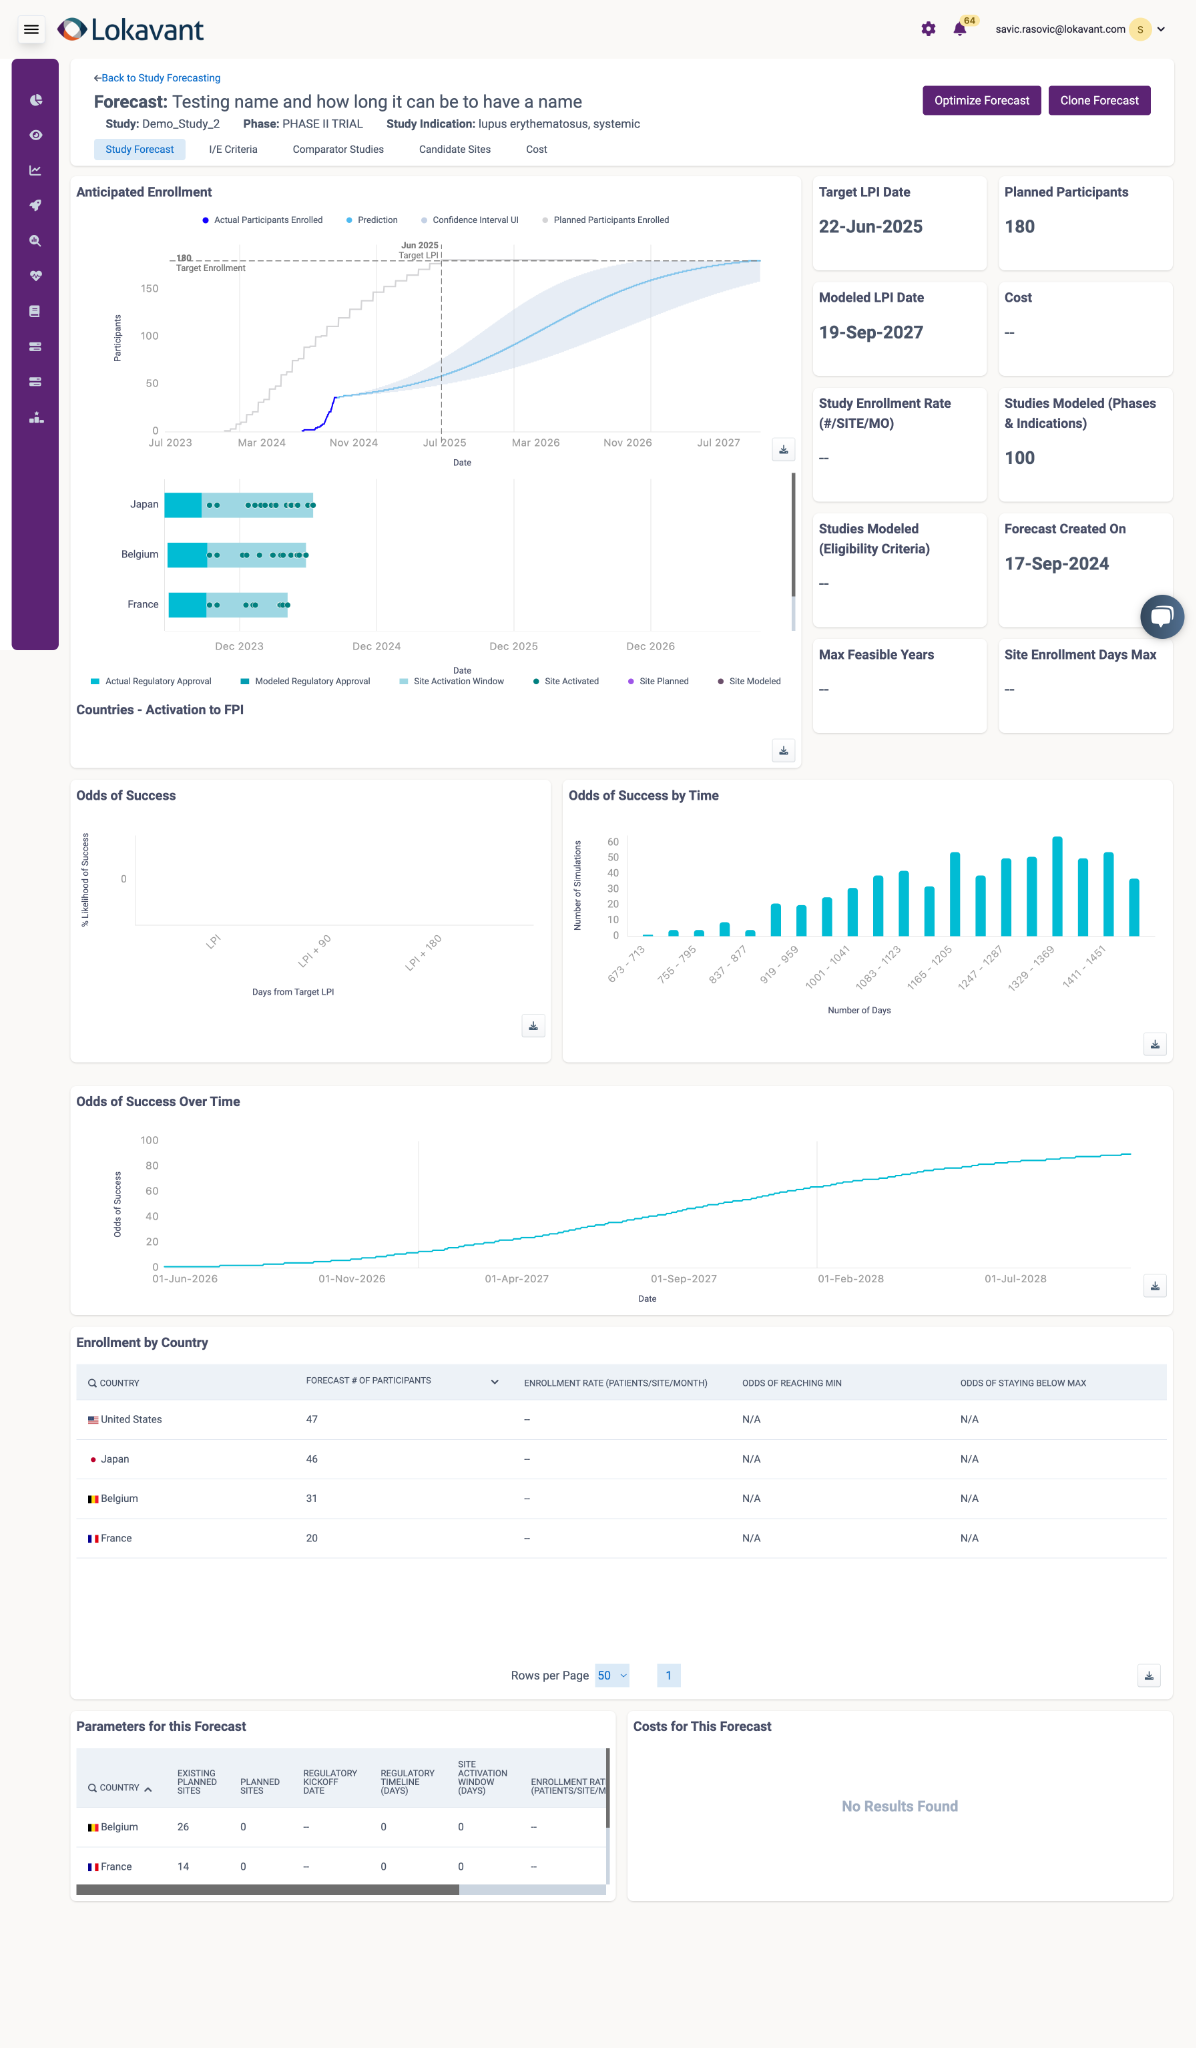
Make enrollment trajectory, target LPI, country activation, confidence, and odds of success understandable at a glance.
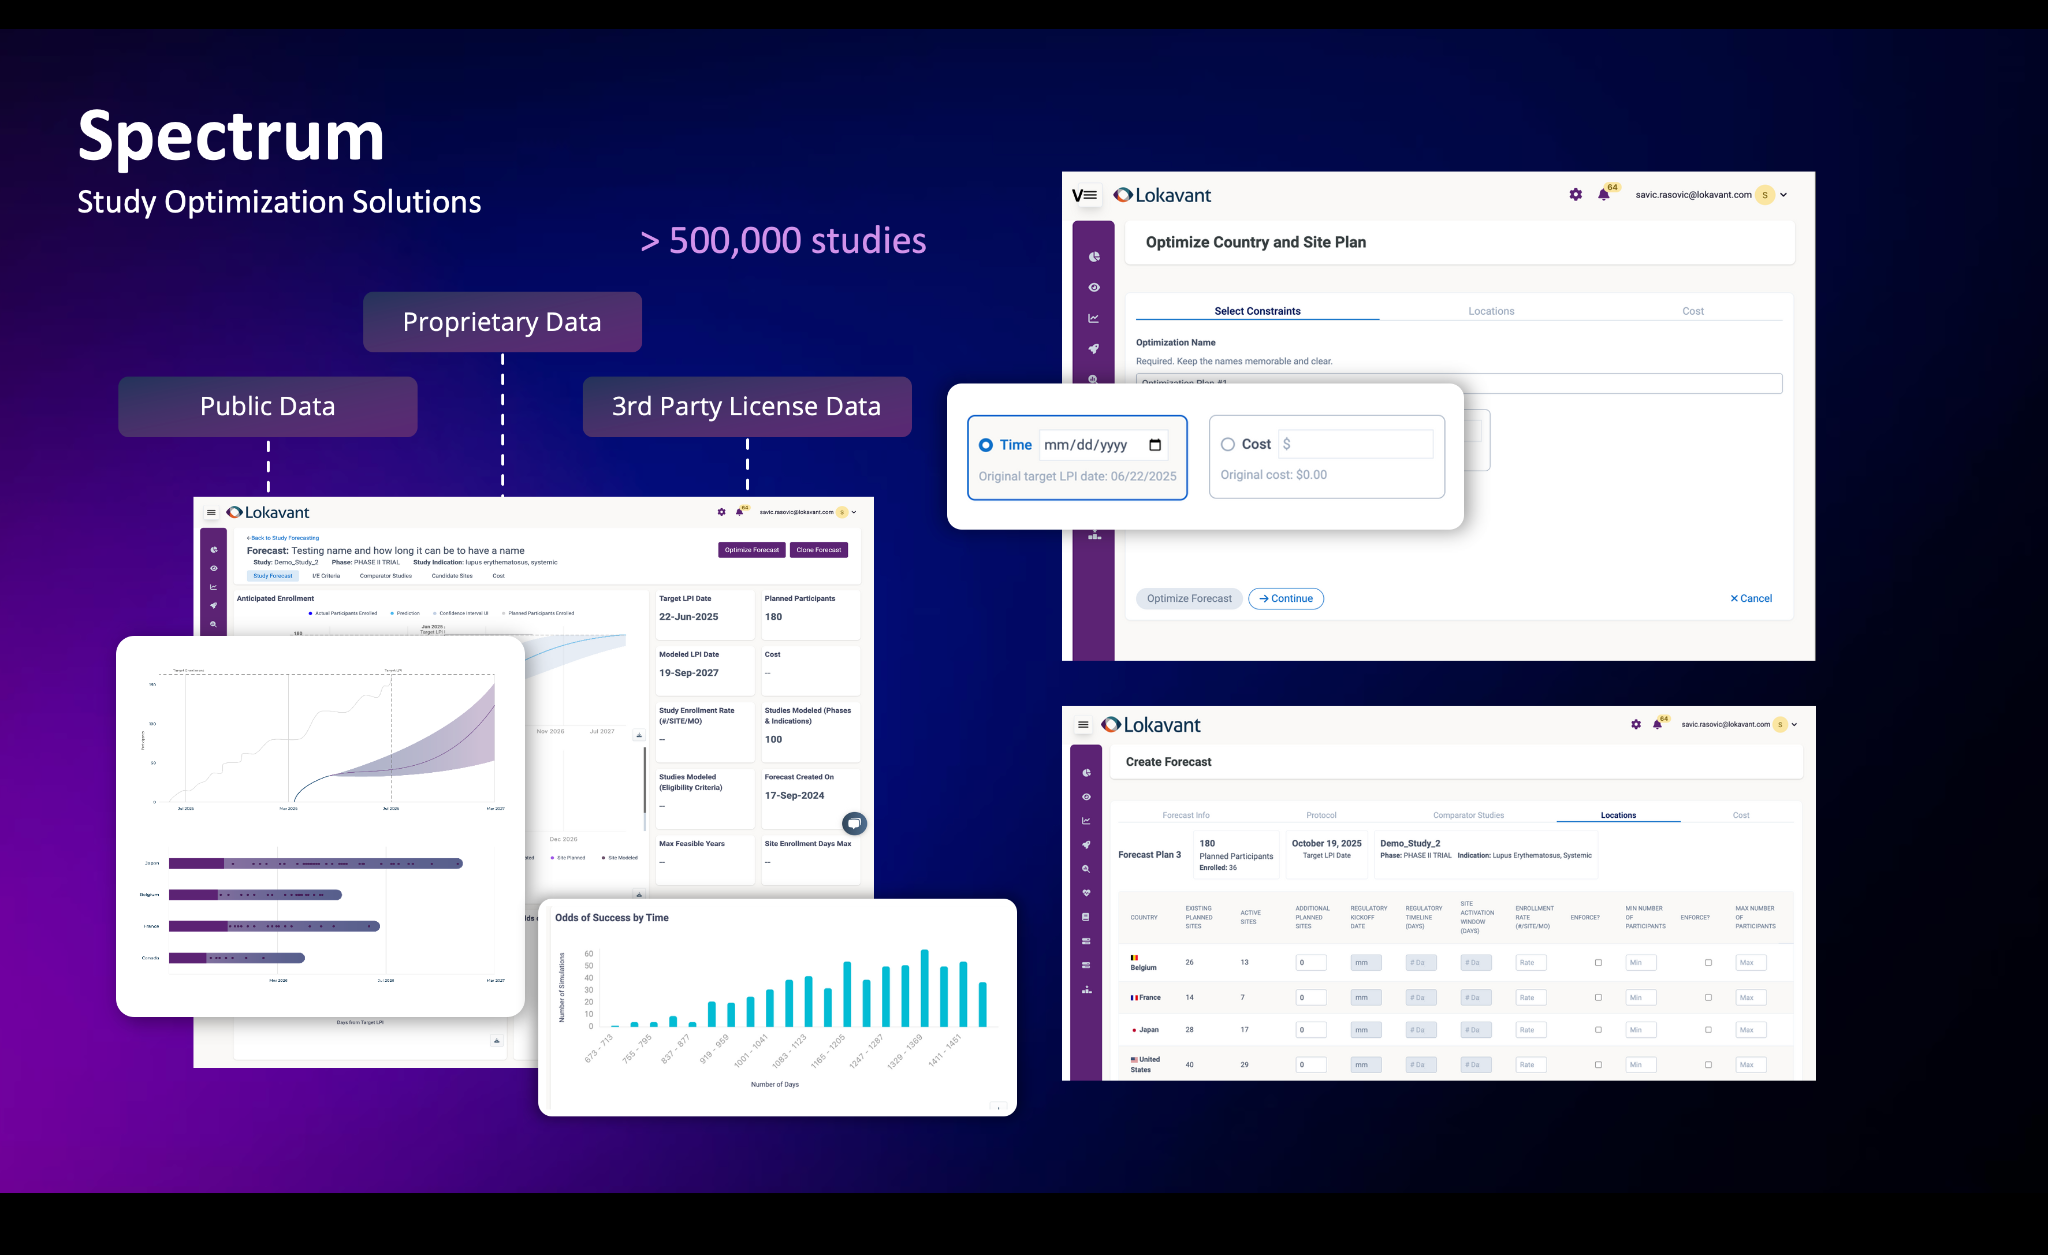
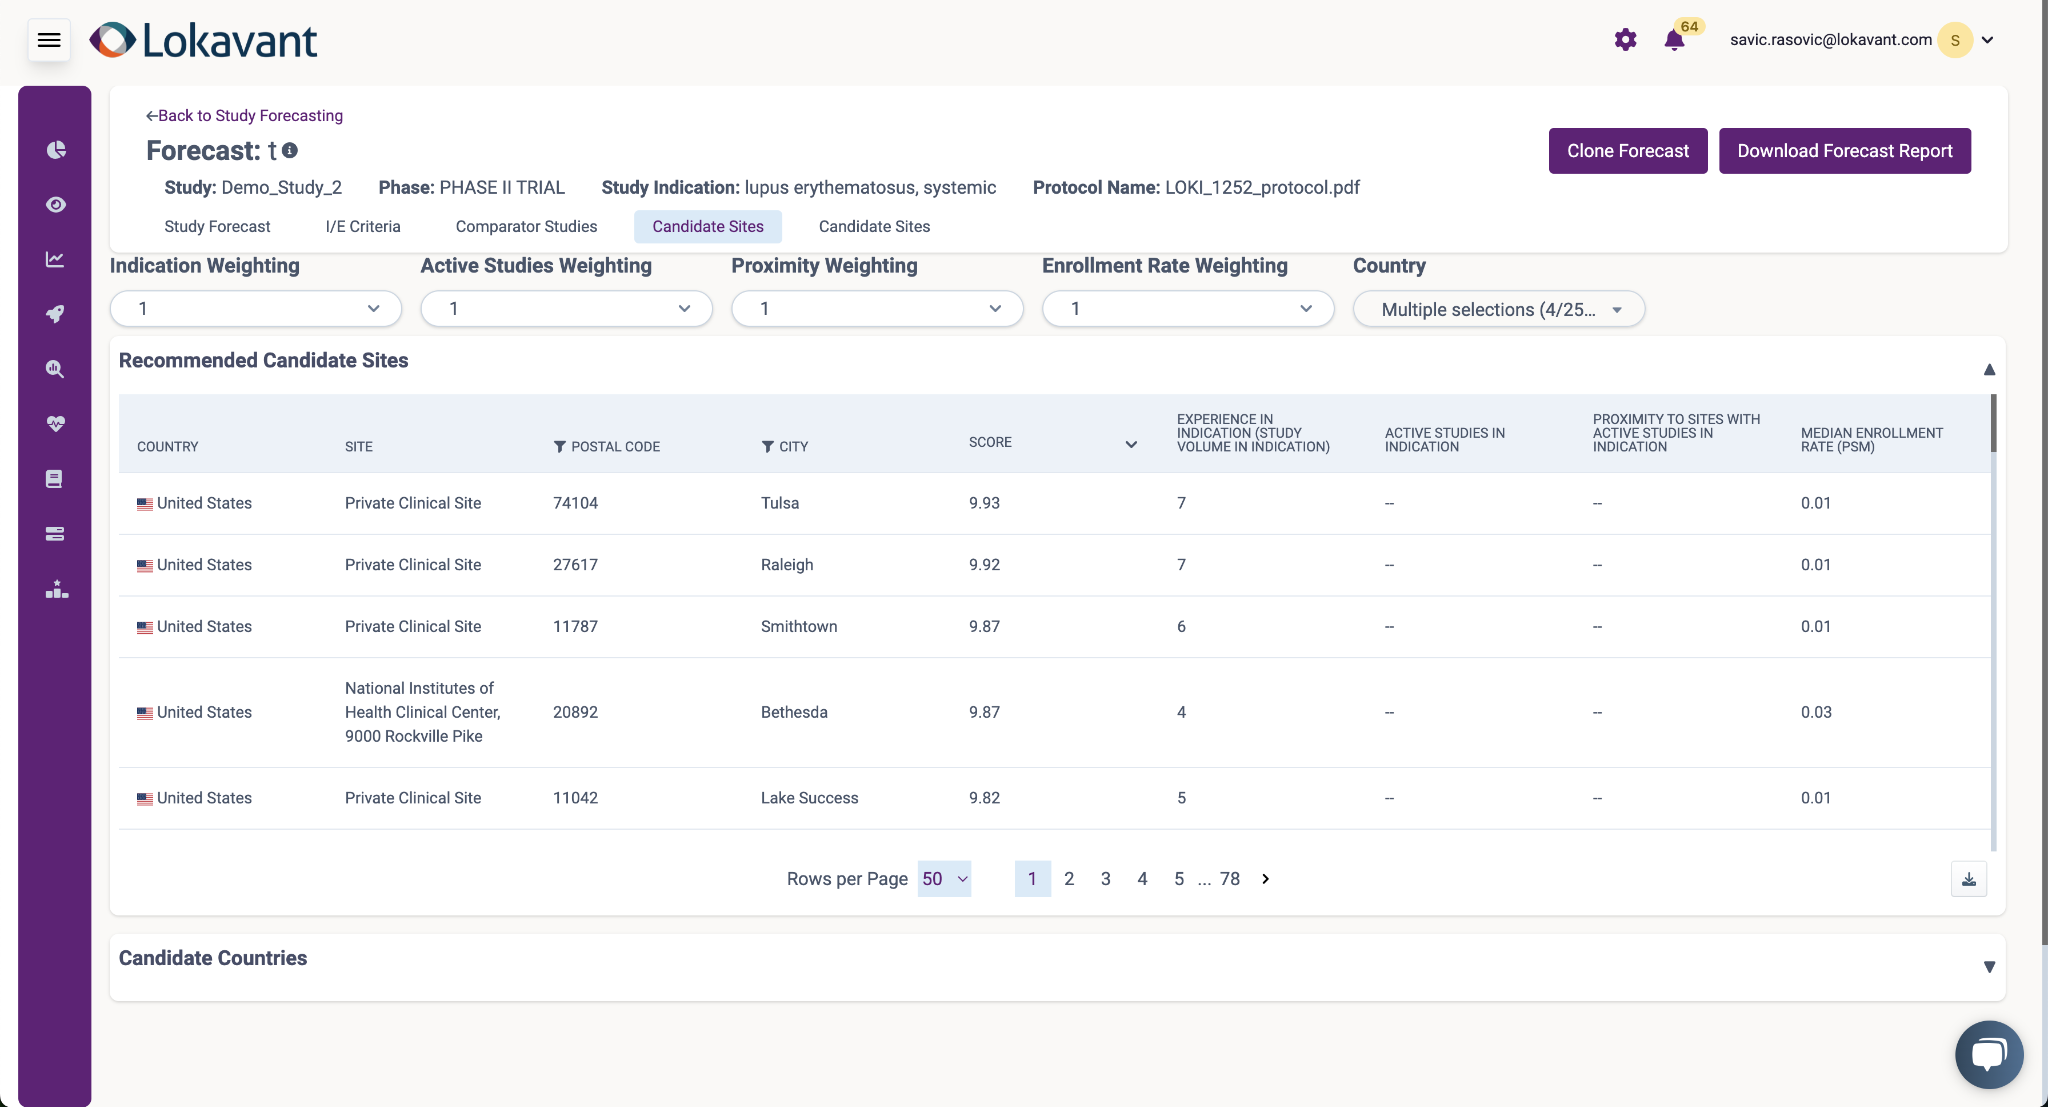
Let teams compare country and site plans, costs, time constraints, and feasibility without obscuring the tradeoffs.
Bring actual study data back into the forecast so teams could replan without starting over or losing context.
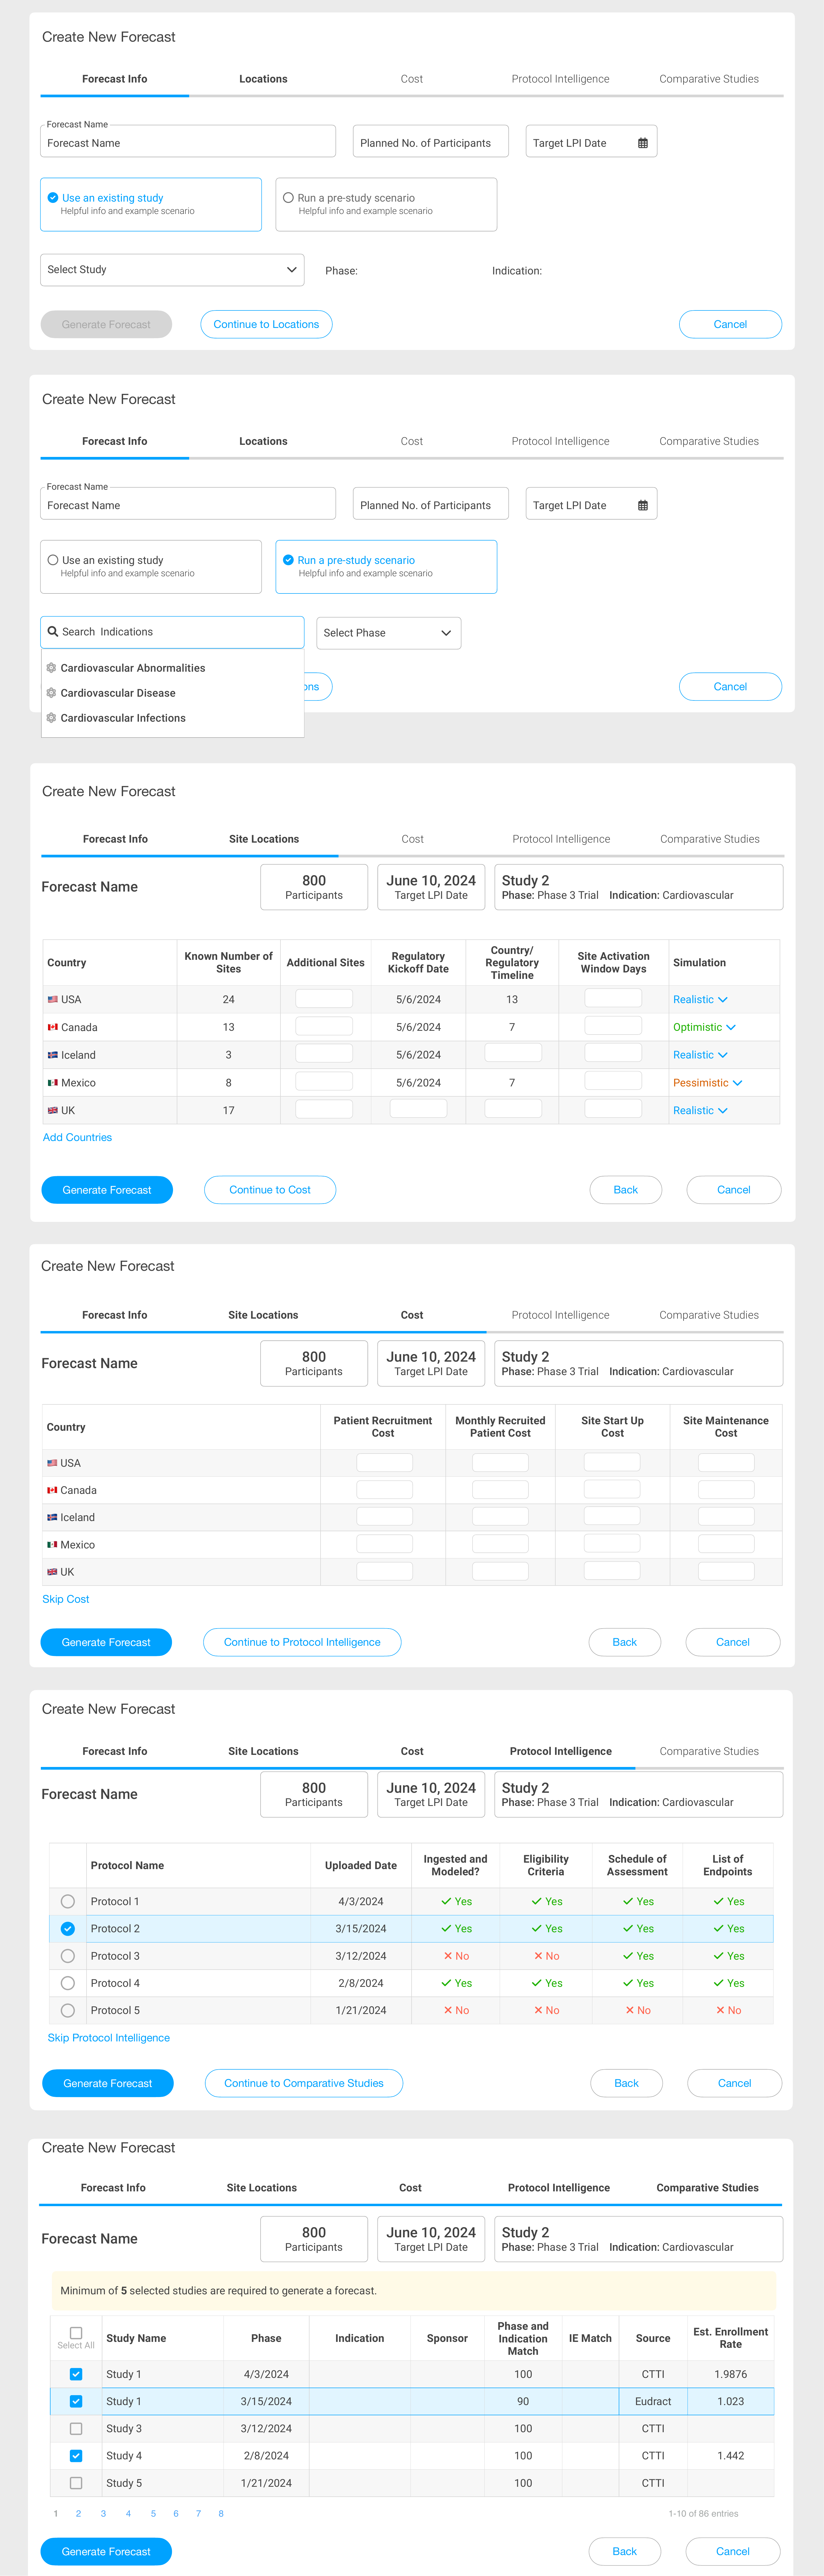
Execution / Building a forecast
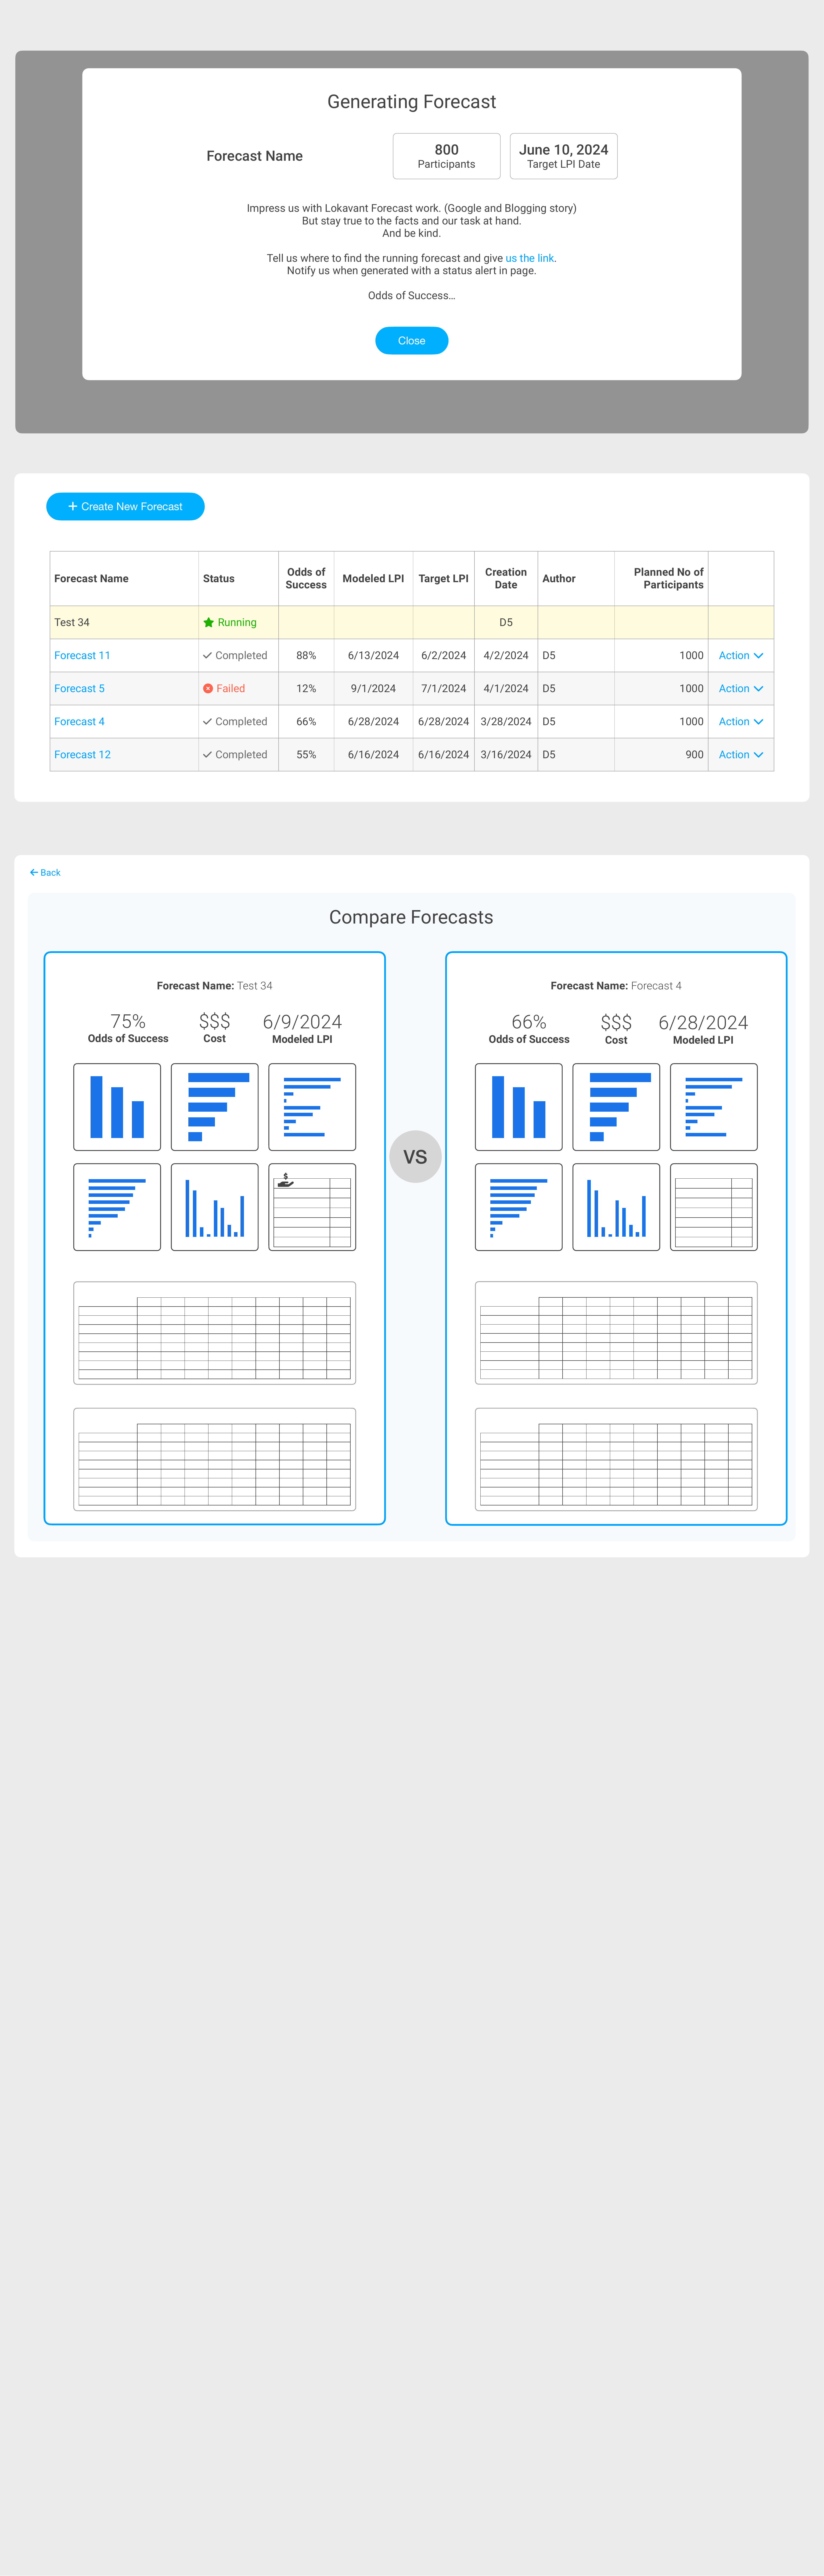
The workflow moved from study definition through country and site assumptions, cost, protocol intelligence, and comparable studies. Users could start from an existing study or run a pre-study scenario, while the product preserved progress and made generation status visible.
Execution / Making uncertainty legible
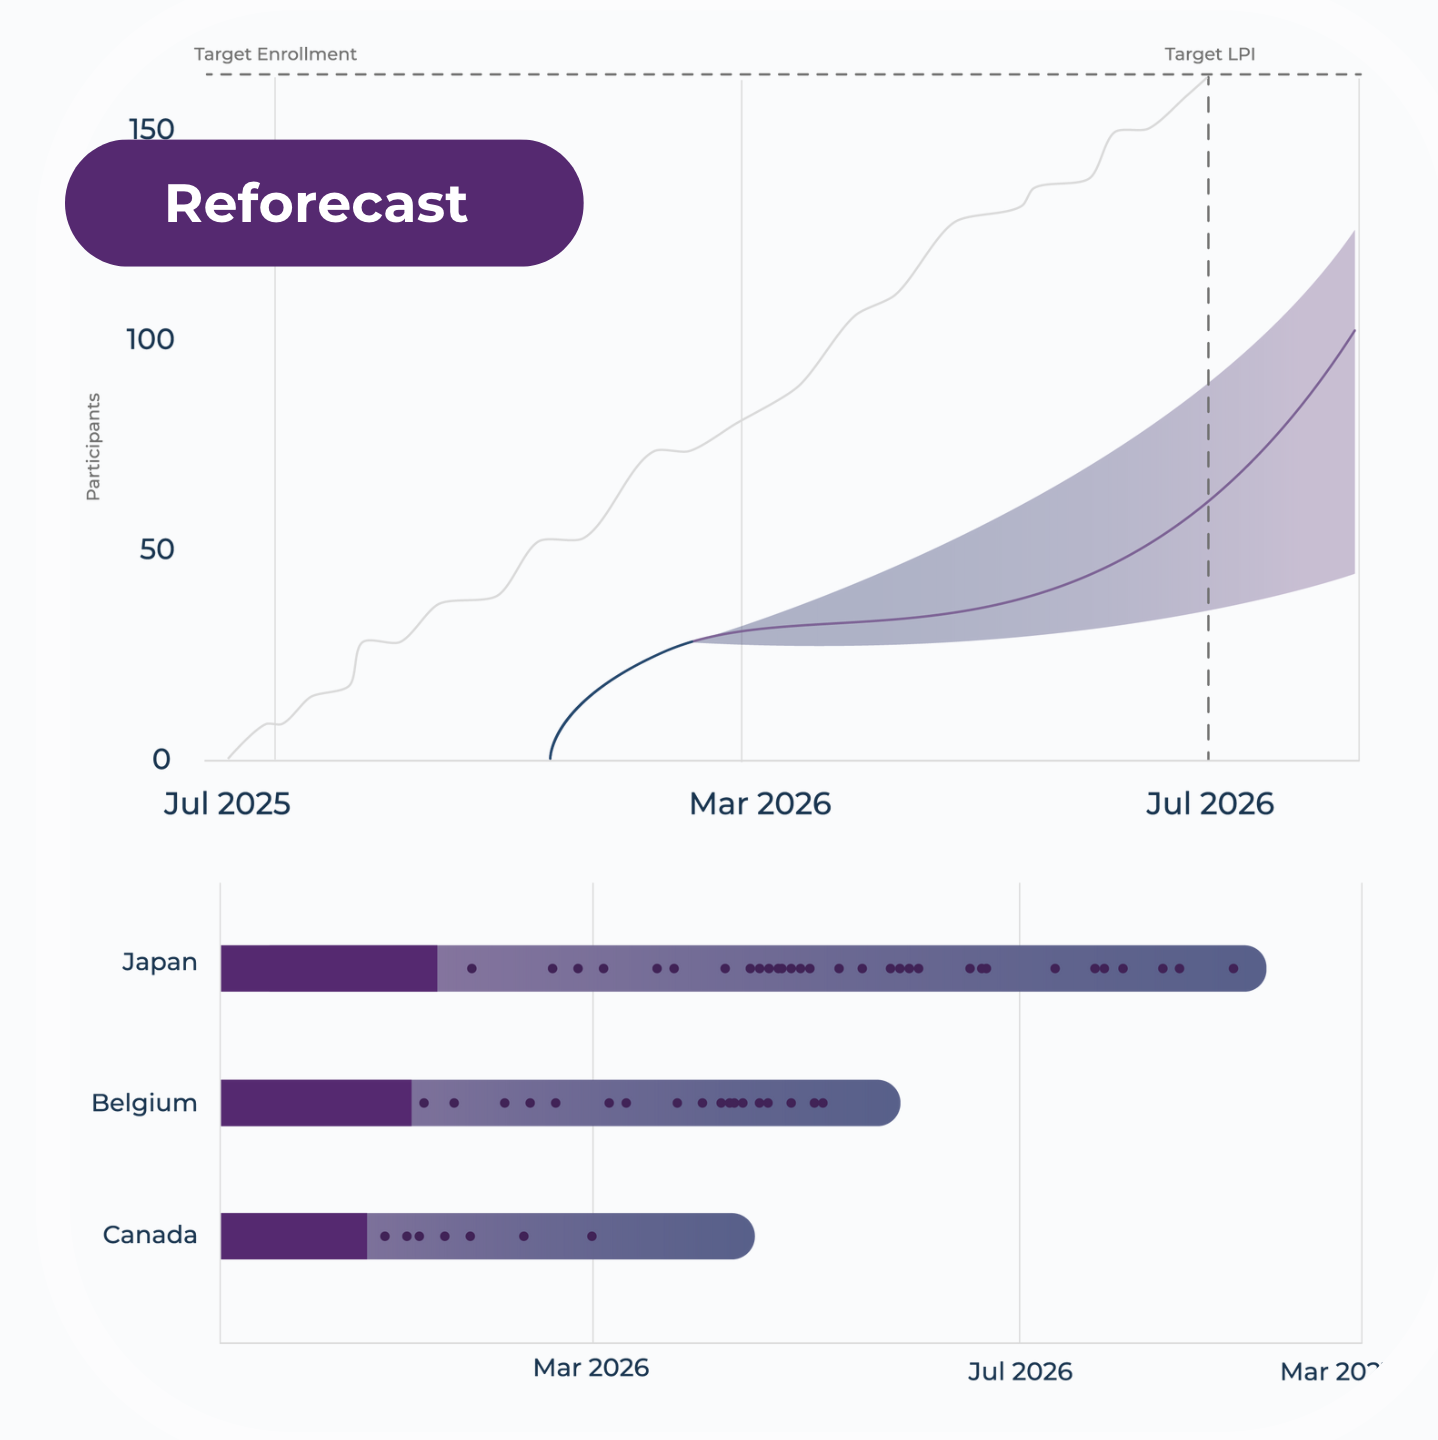
Trust required more than a forecast line. The interaction distinguished actual enrollment, predicted performance, confidence bounds, and the original plan, then connected the trajectory to country-level regulatory and site-activation activity.
Execution / Make tradeoffs explicit
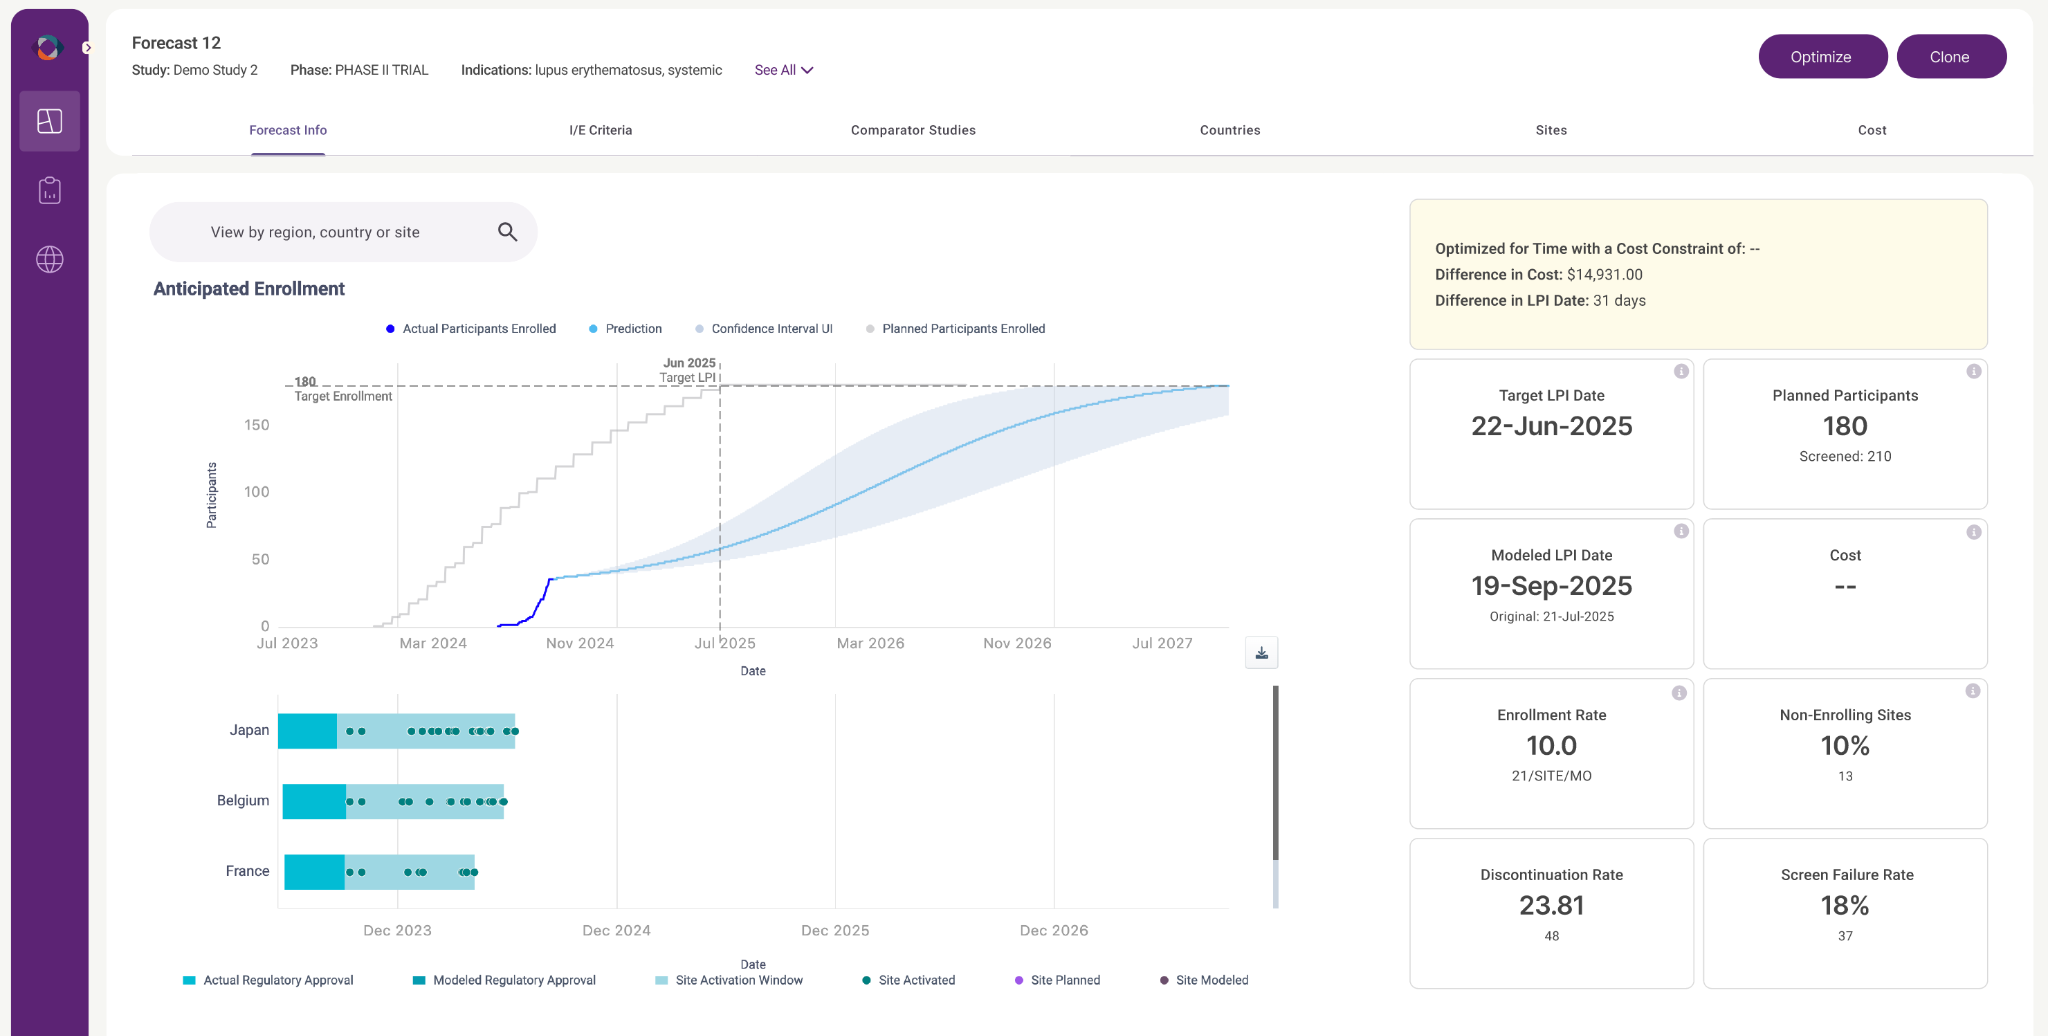
Optimization could not behave like a black-box recommendation. Results exposed the cost difference, LPI difference, enrollment trajectory, and operational assumptions behind the proposed plan.
What shipped
The work extended from production workflows and reusable components into the demos, visual language, website, video, and social content used to explain the product.
Study setup, enrollment projections, confidence ranges, comparator evidence, scenarios, cloning, and reforecasting.
Country and site planning, candidate-site ranking, weights, cost constraints, time constraints, and explicit tradeoffs.
Shared design language and components connecting Figma, production UI, front-end implementation, and sales demos.
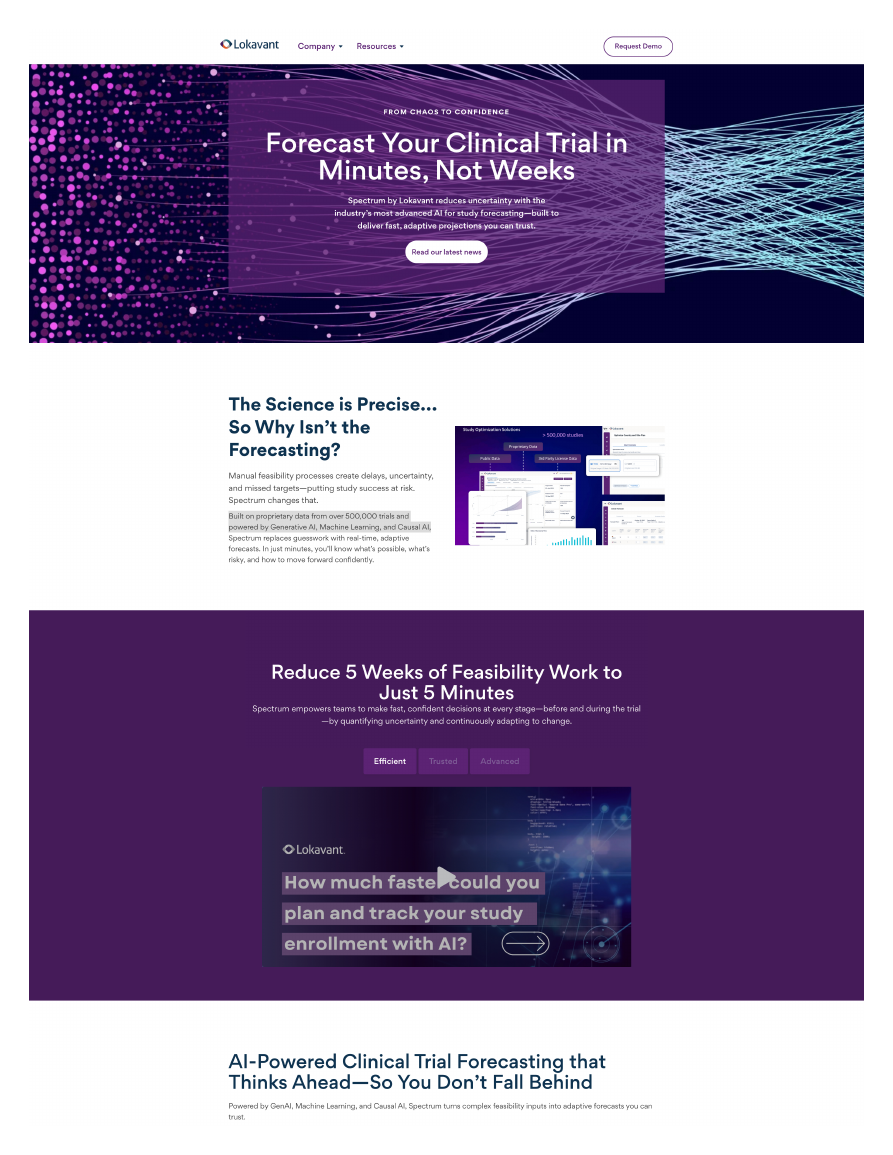
Positioning, website, videos, social campaigns, and editorial content grounded in the same product decisions.
Impact
Demo-production and campaign metrics describe the reusable design and go-to-market system. The forecast-generation and study-count figures are Lokavant product and platform claims presented in shipped materials. Product, clinical, data science, engineering, sales, and marketing contributed to the product and business outcomes.
What it proved
The strongest design work was not making the model appear intelligent. It was making the evidence, uncertainty, constraints, and consequences clear enough for people to act.
Confidence ranges, comparisons, assumptions, system states, and explicit tradeoffs make an AI recommendation inspectable rather than magical.
Complex enterprise products become usable when information architecture follows the work people must complete—not the shape of the underlying data.
Product UX, engineering, demos, positioning, and marketing become faster and more credible when they share the same language and system.